Sixth Competition following Youhan Lee's curriculum. Multi-class classification competition using image data.
TensorFlow Speech Recognition Challenge
Can you build an algorithm that understands simple speech commands?
www.kaggle.com
First Kernel: Speech representation and data exploration
- Mainly about exploring speech data.
Insight / Summary:
1. Visualization
- There are two theories of a human hearing - place(frequency-based) and temporal. frequency - 주파수
- In speech recognition, I see two main tendencies - 1. to input spectrogram (frequencies), 2. and more sophisticated features MFCC - Mel-Frequency Cepstral Coefficients, PLP.
- You rarely work with raw, temporal data.
1) Wave and spectrogram
Function that calculates spectogram:
def log_specgram(audio, sample_rate, window_size=20,
                 step_size=10, eps=1e-10):
    nperseg = int(round(window_size * sample_rate / 1e3))
    noverlap = int(round(step_size * sample_rate / 1e3))
    freqs, times, spec = signal.spectrogram(audio,
                                    fs=sample_rate,
                                    window='hann',
                                    nperseg=nperseg,
                                    noverlap=noverlap,
                                    detrend=False)
return freqs, times, np.log(spec.T.astype(np.float32) + eps)- We are taking logarithm of spectrogram values.
- It will make our plot much more clear, moreover, it is strictly connected to the way people hear.
- We need to assure that there are no 0 values as input to logarithm.
- Frequencies are in range (0, 8000) according to Nyquist theorem.
freqs, times, spectrogram = log_specgram(samples, sample_rate)

fig = plt.figure(figsize=(14, 8))
ax1 = fig.add_subplot(211)
ax1.set_title('Raw wave of ' + filename)
ax1.set_ylabel('Amplitude')
ax1.plot(np.linspace(0, sample_rate/len(samples), sample_rate), samples)

ax2 = fig.add_subplot(212)
ax2.imshow(spectrogram.T, aspect='auto', origin='lower',
           extent=[times.min(), times.max(), freqs.min(), freqs.max()])
ax2.set_yticks(freqs[::16])
ax2.set_xticks(times[::16])
ax2.set_title('Spectrogram of ' + filename)
ax2.set_ylabel('Freqs in Hz')
ax2.set_xlabel('Seconds')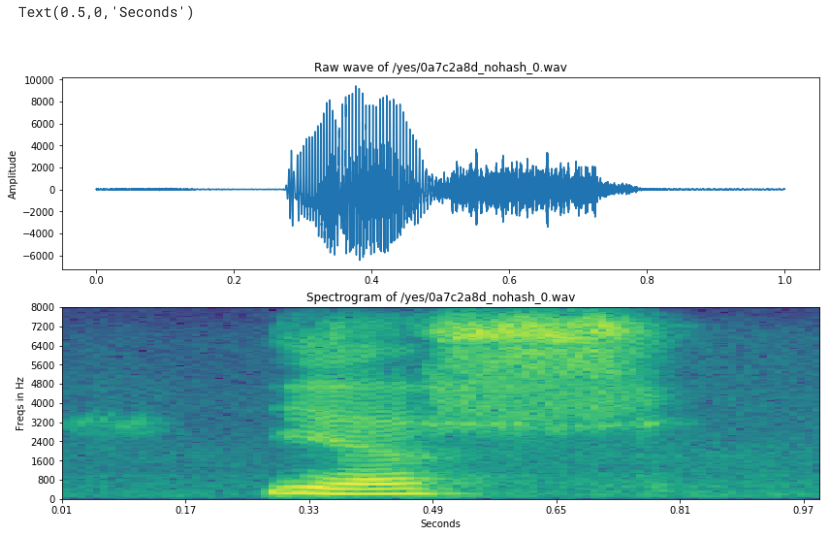
- If we use spectrogram as an input features for NN, we have to remember to normalize features.
- We need to normalize over all the dataset.
- There is an interesting fact to point out.
- We have ~160 features for each frame, frequencies are between 0 and 8000. It means, that one feature corresponds to 50 Hz.
- However, frequency resolution of the ear is 3.6 Hz within the octave of 1000 – 2000 Hz
- It means, that people are far more precise and can hear much smaller details than those represented by spectrograms like above.
2) MFCC
- Details about MFCC: MFCC explained
- You can see, that it is well prepared to imitate human hearing properties.
- You can calculate Mel power spectrogram and MFCC using for example librosa python package.
- Mel Power?
- Mel Scale:
- The human ear detects small changes well at low frequencies, but requires larger changes to perceive differences at high frequencies
- The Mel scale is a frequency scale that reflects these characteristics of human hearing
- Power Spectrum:
- Represents the energy distribution across frequencies in an audio signal
- It is the squared value of frequency components obtained through Fourier transform
- Mel Power:
- It is the conversion of regular power spectrum to the Mel scale
- According to human auditory characteristics, the low-frequency region is represented more finely, while the high-frequency region is represented more broadly
- Mel Scale:
# From this tutorial
# https://github.com/librosa/librosa/blob/master/examples/LibROSA%20demo.ipynb
S = librosa.feature.melspectrogram(samples, sr=sample_rate, n_mels=128)

# Convert to log scale (dB). We'll use the peak power (max) as reference.
log_S = librosa.power_to_db(S, ref=np.max)

plt.figure(figsize=(12, 4))
librosa.display.specshow(log_S, sr=sample_rate, x_axis='time', y_axis='mel')
plt.title('Mel power spectrogram ')
plt.colorbar(format='%+02.0f dB')
plt.tight_layout()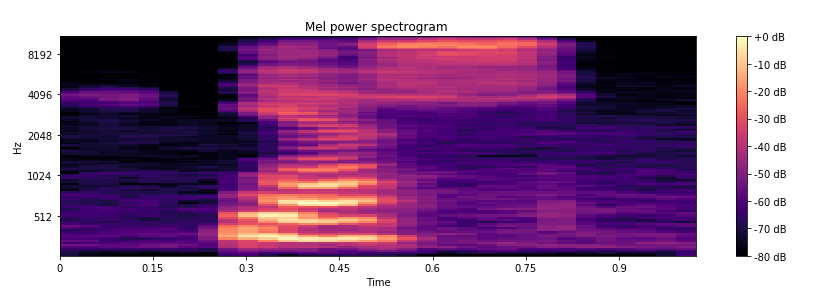
mfcc = librosa.feature.mfcc(S=log_S, n_mfcc=13)

# Let's pad on the first and second deltas while we're at it
delta2_mfcc = librosa.feature.delta(mfcc, order=2)

plt.figure(figsize=(12, 4))
librosa.display.specshow(delta2_mfcc)
plt.ylabel('MFCC coeffs')
plt.xlabel('Time')
plt.title('MFCC')
plt.colorbar()
plt.tight_layout()
- Mel Power Spectrogram
- Audio signal → FFT → Power spectrum → Apply Mel filterbank
- It's a time-frequency domain representation
- Shows energy at mel scale frequencies for each time period
- Preserves the overall spectral characteristics of speech
- Audio signal → FFT → Power spectrum → Apply Mel filterbank
- MFCC (Mel-frequency cepstral coefficients)
- Takes one step further from Mel Power Spectrogram by applying DCT (Discrete Cosine Transform)
- Process: Audio signal → FFT → Power spectrum → Mel filterbank → log → DCT
- It's a representation in the cepstral domain rather than the frequency domain
- Usually provides more compressed features using only 12-13 coefficients
- Takes one step further from Mel Power Spectrogram by applying DCT (Discrete Cosine Transform)
- In classical, but still state-of-the-art systems, MFCC or similar features are taken as the input to the system instead of spectrograms.
- However, in end-to-end (often neural-network based) systems, the most common input features are probably raw spectrograms, or mel power spectrograms.
- For example MFCC decorrelates features, but NNs deal with correlated features well.
- Also, if you'll understand mel filters, you may consider their usage sensible.a
- It is your decision which to choose
3) Silence Removal
- When the audio has some amount of silence in them, although the audio are short, considering some VAD(Voice Activity Detection) will be useful.
- A decent VAD can reduce training size a lot, accelerating training speed significantly.
- Cut a bit of the file from the beginning and from the end and listen to it again (based on a plot above, we take from 4000 to 13000)
- The audio would sound clearer obviously.
- It is impossible to cut all the files manually and do this basing on the simple plot.
- But you can use for example webrtcvad package to have a good VAD.
Let's plot it again, together with guessed alignment of 'y' 'e' 's' graphems
freqs, times, spectrogram_cut = log_specgram(samples_cut, sample_rate)

fig = plt.figure(figsize=(14, 8))
ax1 = fig.add_subplot(211)
ax1.set_title('Raw wave of ' + filename)
ax1.set_ylabel('Amplitude')
ax1.plot(samples_cut)

ax2 = fig.add_subplot(212)
ax2.set_title('Spectrogram of ' + filename)
ax2.set_ylabel('Frequencies * 0.1')
ax2.set_xlabel('Samples')
ax2.imshow(spectrogram_cut.T, aspect='auto', origin='lower',
           extent=[times.min(), times.max(), freqs.min(), freqs.max()])
ax2.set_yticks(freqs[::16])
ax2.set_xticks(times[::16])
ax2.text(0.06, 1000, 'Y', fontsize=18)
ax2.text(0.17, 1000, 'E', fontsize=18)
ax2.text(0.36, 1000, 'S', fontsize=18)

xcoords = [0.025, 0.11, 0.23, 0.49]
for xc in xcoords:
    ax1.axvline(x=xc*16000, c='r')
    ax2.axvline(x=xc, c='r')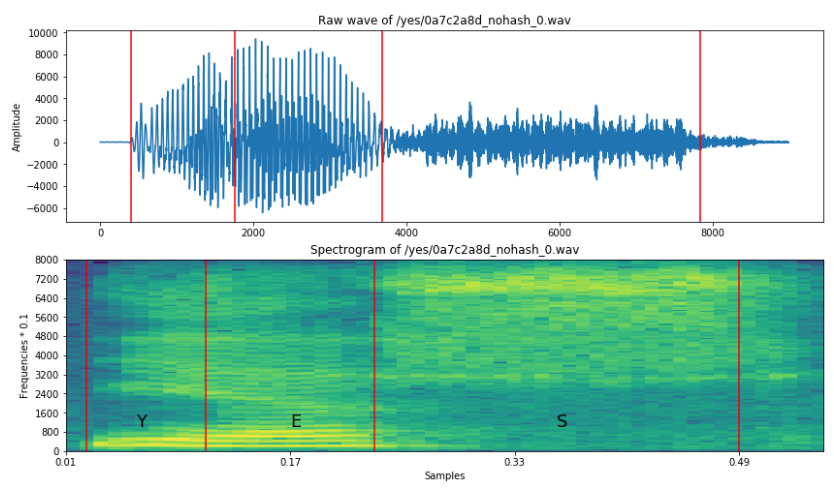
4) Resampling - dimensionality reduction
- Another way to reduce the dimensionality of our data is to resample recordings.
- You can hear that the recording don't sound very natural, because they are sampled with 16k frequency, and we usually hear much more.
- However, the most speech related frequencies are presented in smaller band.
- That's why you can still understand another person talking to the telephone, where GSM signal is sampled to 8000 Hz.
- Summarizing, we could resample our dataset to 8k. We will discard some information that shouldn't be important, and we'll reduce size of the data.
- We have to remember that it can be risky, because this is a competition, and sometimes very small difference in performance wins, so we don't want to lost anything.
- On the other hand, first experiments can be done much faster with smaller training size.
- We'll need to calculate FFT (Fast Fourier Transform).
def custom_fft(y, fs):
    T = 1.0 / fs
    N = y.shape[0]
    yf = fft(y)
    xf = np.linspace(0.0, 1.0/(2.0*T), N//2)
    vals = 2.0/N * np.abs(yf[0:N//2])  # FFT is simmetrical, so we take just the first half
    # FFT is also complex, to we take just the real part (abs)
    return xf, vals
filename = '/happy/0b09edd3_nohash_0.wav'
new_sample_rate = 8000
sample_rate, samples = wavfile.read(str(train_audio_path) + filename)
resampled = signal.resample(samples, int(new_sample_rate/sample_rate * samples.shape[0]))We can also compare FFT, Notice, that there is almost no information above 4000 Hz in original signal.
xf, vals = custom_fft(samples, sample_rate)
plt.figure(figsize=(12, 4))
plt.title('FFT of recording sampled with ' + str(sample_rate) + ' Hz')
plt.plot(xf, vals)
plt.xlabel('Frequency')
plt.grid()
plt.show()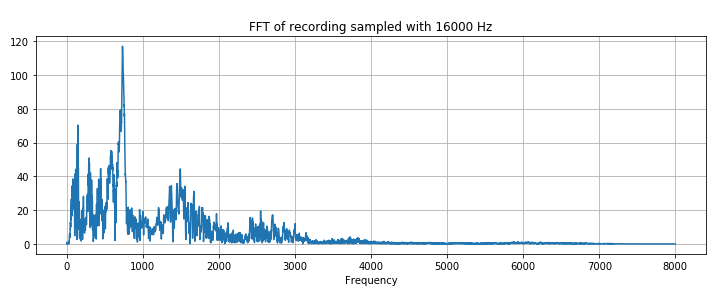
xf, vals = custom_fft(resampled, new_sample_rate)
plt.figure(figsize=(12, 4))
plt.title('FFT of recording sampled with ' + str(new_sample_rate) + ' Hz')
plt.plot(xf, vals)
plt.xlabel('Frequency')
plt.grid()
plt.show()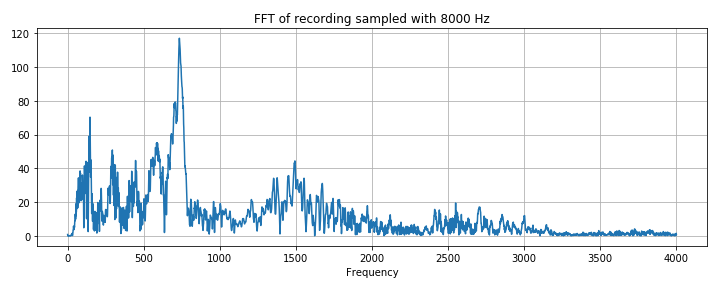
This is how we reduced dataset size twice
5) Features extraction steps
- I would propose the feature extraction algorithm like that:
- Resampling
- VAD
- Maybe padding with 0 to make signals be equal length
- Log spectrogram (or MFCC, or PLP)
- Features normalization with mean and std
- Stacking of a given number of frames to get temporal information
2. Dataset investigation
1) Number of records
2) Deeper into recordings
- There's a very important fact: Recordings come from very different sources.
- As far as I can tell, some of them can come from mobile GSM channel.
- Nevertheless, it is extremely important to split the dataset in a way that one speaker doesn't occur in both train and test sets.
- There are also recordings with some weird silence (some compression?)
- It means, that we have to prevent overfitting to the very specific acoustical environments.
3) Recordings length
4) Mean spectrograms and FFT
plot mean FFT for every word:
to_keep = 'yes no up down left right on off stop go'.split()
dirs = [d for d in dirs if d in to_keep]

print(dirs)

for direct in dirs:
    vals_all = []
    spec_all = []

    waves = [f for f in os.listdir(join(train_audio_path, direct)) if f.endswith('.wav')]
    for wav in waves:
        sample_rate, samples = wavfile.read(train_audio_path + direct + '/' + wav)
        if samples.shape[0] != 16000:
            continue
        xf, vals = custom_fft(samples, 16000)
        vals_all.append(vals)
        freqs, times, spec = log_specgram(samples, 16000)
        spec_all.append(spec)

    plt.figure(figsize=(14, 4))
    plt.subplot(121)
    plt.title('Mean fft of ' + direct)
    plt.plot(np.mean(np.array(vals_all), axis=0))
    plt.grid()
    plt.subplot(122)
    plt.title('Mean specgram of ' + direct)
    plt.imshow(np.mean(np.array(spec_all), axis=0).T, aspect='auto', origin='lower',
               extent=[times.min(), times.max(), freqs.min(), freqs.max()])
    plt.yticks(freqs[::16])
    plt.xticks(times[::16])
    plt.show()

    # result: ['down', 'go', 'left', 'no', 'off', 'on', 'right', 'stop', 'up', 'yes']
5) Gaussian Mixtures modeling
- We can see that mean FFT looks different for every word.
- We could model each FFT with a mixture of Gaussian distributions.
- Some of them however, look almost identical on FFT, like stop and up... But wait, they are still distinguishable when we look at spectrograms
- High frequencies are earlier than low at the beginning of stop (probably s).
- That's why temporal component is also necessary.
- There is a Kaldi library, that can model words (or smaller parts of words) with GMMs and model temporal dependencies with Hidden Markov Models.
- We could use simple GMMs for words to check what can we model and how hard it is to distinguish the words.
- We can use Scikit-learn for that, however it is not straightforward and lasts very long here, so I abandon this idea for now.
6) Frequency components across the words
def violinplot_frequency(dirs, freq_ind):
    """ Plot violinplots for given words (waves in dirs) and frequency freq_ind
    from all frequencies freqs."""

    spec_all = []  # Contain spectrograms
    ind = 0
    for direct in dirs:
        spec_all.append([])

        waves = [f for f in os.listdir(join(train_audio_path, direct)) if
                 f.endswith('.wav')]
        for wav in waves[:100]:
            sample_rate, samples = wavfile.read(
                train_audio_path + direct + '/' + wav)
            freqs, times, spec = log_specgram(samples, sample_rate)
            spec_all[ind].extend(spec[:, freq_ind])
        ind += 1

    # Different lengths = different num of frames. Make number equal
    minimum = min([len(spec) for spec in spec_all])
    spec_all = np.array([spec[:minimum] for spec in spec_all])

    plt.figure(figsize=(13,7))
    plt.title('Frequency ' + str(freqs[freq_ind]) + ' Hz')
    plt.ylabel('Amount of frequency in a word')
    plt.xlabel('Words')
    sns.violinplot(data=pd.DataFrame(spec_all.T, columns=dirs))
    plt.show()
7) Anomaly detection
- We should check if there are any recordings that somehow stand out from the rest.
- We can lower the dimensionality of the dataset and interactively check for any anomaly.
- We'll use PCA for dimensionality reduction:
fft_all = []
names = []
for direct in dirs:
    waves = [f for f in os.listdir(join(train_audio_path, direct)) if f.endswith('.wav')]
    for wav in waves:
        sample_rate, samples = wavfile.read(train_audio_path + direct + '/' + wav)
        if samples.shape[0] != sample_rate:
            samples = np.append(samples, np.zeros((sample_rate - samples.shape[0], )))
        x, val = custom_fft(samples, sample_rate)
        fft_all.append(val)
        names.append(direct + '/' + wav)

fft_all = np.array(fft_all)

# Normalization
fft_all = (fft_all - np.mean(fft_all, axis=0)) / np.std(fft_all, axis=0)

# Dim reduction
pca = PCA(n_components=3)
fft_all = pca.fit_transform(fft_all)

def interactive_3d_plot(data, names):
    scatt = go.Scatter3d(x=data[:, 0], y=data[:, 1], z=data[:, 2], mode='markers', text=names)
    data = go.Data([scatt])
    layout = go.Layout(title="Anomaly detection")
    figure = go.Figure(data=data, layout=layout)
    py.iplot(figure)

interactive_3d_plot(fft_all, names)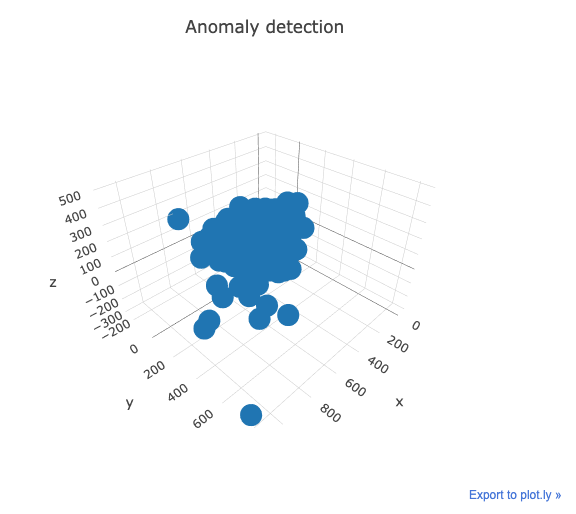
Notice that there are yes/e4b02540_nohash_0.wav, go/0487ba9b_nohash_0.wav and more points, that lie far away from the rest.
3. Where to look for the inspiration
- You can take many different approches for the competition. I can't really advice any of that. I'd like to share my initial thoughts.
- There is a trend in recent years to propose solutions based on neural networks. Usually there are two architectures. My ideas are here.
- Encoder-decoder: https://arxiv.org/abs/1508.01211
- RNNs with CTC loss: https://arxiv.org/abs/1412.5567
- For me, 1 and 2 are a sensible choice for this competition, especially if you do not have background in SR field.
- They try to be end-to-end solutions.
- Speech recognition is a really big topic and it would be hard to get to know important things in short time.
- Classic speech recognition is described here: http://www.ece.ucsb.edu/Faculty/Rabiner/ece259/Reprints/tutorial%20on%20hmm%20and%20applications.pdf
- You can find Kaldi Tutorial for dummies, with a problem similar to this competition in some way.
- Very deep CNN
- Don't know if it is used for SR.
- However, most papers concern Large Vocabulary Continuous Speech Recognition Systems (LVCSR).
- We got different task here - a very small vocabulary, and recordings with only one word in it, with a (mostly) given length.
- I suppose such approach can win the competition.
- Very deep CNN
Second Kernel: Light-Weight CNN LB 0.74
- This notebooks aims to build a light-weight CNN.
- It uses specgrams of resampled wav files(rate 8000) as inputs.
- Due to Kaggle cloud hardware limitations, this script is a 'crippled' version of the original one.
- In order to get LB 0.74, you need to set epoch to 5, set chop_audio(num=1000) and double all Conv layer parameters.
- Although this script is a slight imrpovement over Alex Ozerin's baseline, I believe by using original wav files(16000 sample rate) one can achieve higher scores.
Insight / Summary:
1. Improve This Script
- Since this is only a light-weight CNN, it's performance is limited. Here are some ways to improve it's performance.
- Use original wav files instead resampled ones.
- Create more 'silence' wav files using chop_audio.
- Build deeper CNN or use RNN.
- Train for longer epochs
2. Process
1) The original sample rate is 16000, and we will resample it to 8000 to reduce data size.
2) Next, we use functions declared below to generate x_train and y_train. label_index is the index used by pandas to create dummy values, we need to save it for later use.
- pad_audio will pad audios that are less than 16000(1 second) with 0s to make them all have the same length.
- chop_audio will chop audios that are larger than 16000(eg. wav files in background noises folder) to 16000 in length. In addition, it will create several chunks out of one large wav files given the parameter 'num'.
- label_transform transform labels into dummies values. It's used in combination with softmax to predict the label.
3) Test data is way too large to fit in RAM, we need to process them one by one. Generator test_data_generator will create batches of test wav files to feed into CNN.
4) We use the trained model to predict the test data's labels. However, since Kaggle doesn't provide test data, the following sections won't be executed here.
5) We use the trained model to predict the test data's labels. However, since Kaggle doesn't provide test data, the following sections won't be executed here.
model:
input_shape = (99, 81, 1)
nclass = 12
inp = Input(shape=input_shape)
norm_inp = BatchNormalization()(inp)
img_1 = Convolution2D(8, kernel_size=2, activation=activations.relu)(norm_inp)
img_1 = Convolution2D(8, kernel_size=2, activation=activations.relu)(img_1)
img_1 = MaxPooling2D(pool_size=(2, 2))(img_1)
img_1 = Dropout(rate=0.2)(img_1)
img_1 = Convolution2D(16, kernel_size=3, activation=activations.relu)(img_1)
img_1 = Convolution2D(16, kernel_size=3, activation=activations.relu)(img_1)
img_1 = MaxPooling2D(pool_size=(2, 2))(img_1)
img_1 = Dropout(rate=0.2)(img_1)
img_1 = Convolution2D(32, kernel_size=3, activation=activations.relu)(img_1)
img_1 = MaxPooling2D(pool_size=(2, 2))(img_1)
img_1 = Dropout(rate=0.2)(img_1)
img_1 = Flatten()(img_1)

dense_1 = BatchNormalization()(Dense(128, activation=activations.relu)(img_1))
dense_1 = BatchNormalization()(Dense(128, activation=activations.relu)(dense_1))
dense_1 = Dense(nclass, activation=activations.softmax)(dense_1)

model = models.Model(inputs=inp, outputs=dense_1)
opt = optimizers.Adam()

model.compile(optimizer=opt, loss=losses.binary_crossentropy)
model.summary()

x_train, x_valid, y_train, y_valid = train_test_split(x_train, y_train, test_size=0.1, random_state=2017)
model.fit(x_train, y_train, batch_size=16, validation_data=(x_valid, y_valid), epochs=3, shuffle=True, verbose=2)

model.save(os.path.join(model_path, 'cnn.model'))
Third Kernel: WavCeption V1: a 1-D Inception approach (LB 0.76)
- Mainly about WavCeption V1 network.
Insight / Summary:
1. Summary
- The WavCeption V1 network seems to produce impressive results compared to a regular convolutional neural network, but in this competition it seems that there is a hard-work on the pre-processing and unknown tracks management.
- It is based on the Google's inception network, the same idea.
- I wrote some weeks ago a module implementing it so that it is easy to build an 1D-inception network by connecting lots of these modules in cascade (as you will see below).
- Unfortunately and due to several Kaggle constraints, it won't run in the kernel machine, so I encourage you to download it and run it in your own machine.
- By running the model for 12h without struggling too much I achieved 0.76 in the leaderboard (with 0.84 in local test). Some other trials in the same line gave me 0.89 in local, so there is a huge improvement in how you deal with the unknown clips :-D
2. Noise generation functions
def ms(x):
    """Mean value of signal `x` squared.
    :param x: Dynamic quantity.
    :returns: Mean squared of `x`.
    """
    return (np.abs(x)**2.0).mean()

def normalize(y, x=None):
    """normalize power in y to a (standard normal) white noise signal.
    Optionally normalize to power in signal `x`.
    #The mean power of a Gaussian with :math:`\\mu=0` and :math:`\\sigma=1` is 1.
    """
    #return y * np.sqrt( (np.abs(x)**2.0).mean() / (np.abs(y)**2.0).mean() )
    if x is not None:
        x = ms(x)
    else:
        x = 1.0
    return y * np.sqrt( x / ms(y) )
    #return y * np.sqrt( 1.0 / (np.abs(y)**2.0).mean() )

def white_noise(N, state=None):
    state = np.random.RandomState() if state is None else state
    return state.randn(N)

def pink_noise(N, state=None):

    state = np.random.RandomState() if state is None else state
    uneven = N%2
    X = state.randn(N//2+1+uneven) + 1j * state.randn(N//2+1+uneven)
    S = np.sqrt(np.arange(len(X))+1.) # +1 to avoid divide by zero
    y = (irfft(X/S)).real
    if uneven:
        y = y[:-1]
    return normalize(y)

def blue_noise(N, state=None):
    """
    Blue noise.

    :param N: Amount of samples.
    :param state: State of PRNG.
    :type state: :class:`np.random.RandomState`

    Power increases with 6 dB per octave.
    Power density increases with 3 dB per octave.

    """
    state = np.random.RandomState() if state is None else state
    uneven = N%2
    X = state.randn(N//2+1+uneven) + 1j * state.randn(N//2+1+uneven)
    S = np.sqrt(np.arange(len(X)))# Filter
    y = (irfft(X*S)).real
    if uneven:
        y = y[:-1]
    return normalize(y)

def brown_noise(N, state=None):
    """
    Violet noise.

    :param N: Amount of samples.
    :param state: State of PRNG.
    :type state: :class:`np.random.RandomState`

    Power decreases with -3 dB per octave.
    Power density decreases with 6 dB per octave.
    """
    state = np.random.RandomState() if state is None else state
    uneven = N%2
    X = state.randn(N//2+1+uneven) + 1j * state.randn(N//2+1+uneven)
    S = (np.arange(len(X))+1)# Filter
    y = (irfft(X/S)).real
    if uneven:
        y = y[:-1]
    return normalize(y)

def violet_noise(N, state=None):
    """
    Violet noise. Power increases with 6 dB per octave.

    :param N: Amount of samples.
    :param state: State of PRNG.
    :type state: :class:`np.random.RandomState`

    Power increases with +9 dB per octave.
    Power density increases with +6 dB per octave.

    """
    state = np.random.RandomState() if state is None else state
    uneven = N%2
    X = state.randn(N//2+1+uneven) + 1j * state.randn(N//2+1+uneven)
    S = (np.arange(len(X)))# Filter
    y = (irfft(X*S)).real
    if uneven:
        y = y[:-1]
    return normalize(y)
3.
- Inception-1D (a.k.a wavception) is a module I designed some weeks ago for this problem.
- It substantially enhances the performance of a regular convolutional neural net.
class BatchNorm(object):
    def __init__(self, epsilon=1e-5, momentum=0.999, name="batch_norm"):
        with tf.variable_scope(name):
            self.epsilon = epsilon
            self.momentum = momentum
            self.name = name

    def __call__(self, x, train=True):
        return tf.contrib.layers.batch_norm(x,
                                            decay=self.momentum,
                                            updates_collections=None,
                                            epsilon=self.epsilon,
                                            scale=True,
                                            is_training=train,
                                            scope=self.name)


def inception_1d(x, is_train, depth, norm_function, activ_function, name):
    """
    Inception 1D module implementation.
    :param x: input to the current module (4D tensor with channels-last)
    :param is_train: it is intented to be a boolean placeholder for controling the BatchNormalization behavior (0D tensor)
    :param depth: linearly controls the depth of the network (int)
    :param norm_function: normalization class (same format as the BatchNorm class above)
    :param activ_function: tensorflow activation function (e.g. tf.nn.relu)
    :param name: name of the variable scope (str)
    """
    with tf.variable_scope(name):
        x_norm = norm_function(name="norm_input")(x, train=is_train)

        # Branch 1: 64 x conv 1x1
        branch_conv_1_1 = tf.layers.conv1d(inputs=x_norm, filters=16*depth, kernel_size=1,
                                           kernel_initializer=tf.contrib.layers.xavier_initializer(),
                                           padding="same", name="conv_1_1")
        branch_conv_1_1 = norm_function(name="norm_conv_1_1")(branch_conv_1_1, train=is_train)
        branch_conv_1_1 = activ_function(branch_conv_1_1, "activation_1_1")

        # Branch 2: 128 x conv 3x3
        branch_conv_3_3 = tf.layers.conv1d(inputs=x_norm, filters=16, kernel_size=1,
                                           kernel_initializer=tf.contrib.layers.xavier_initializer(),
                                           padding="same", name="conv_3_3_1")
        branch_conv_3_3 = norm_function(name="norm_conv_3_3_1")(branch_conv_3_3, train=is_train)
        branch_conv_3_3 = activ_function(branch_conv_3_3, "activation_3_3_1")

        branch_conv_3_3 = tf.layers.conv1d(inputs=branch_conv_3_3, filters=32*depth, kernel_size=3,
                                           kernel_initializer=tf.contrib.layers.xavier_initializer(),
                                           padding="same", name="conv_3_3_2")
        branch_conv_3_3 = norm_function(name="norm_conv_3_3_2")(branch_conv_3_3, train=is_train)
        branch_conv_3_3 = activ_function(branch_conv_3_3, "activation_3_3_2")

        # Branch 3: 128 x conv 5x5
        branch_conv_5_5 = tf.layers.conv1d(inputs=x_norm, filters=16, kernel_size=1,
                                           kernel_initializer=tf.contrib.layers.xavier_initializer(),
                                           padding="same", name="conv_5_5_1")
        branch_conv_5_5 = norm_function(name="norm_conv_5_5_1")(branch_conv_5_5, train=is_train)
        branch_conv_5_5 = activ_function(branch_conv_5_5, "activation_5_5_1")

        branch_conv_5_5 = tf.layers.conv1d(inputs=branch_conv_5_5, filters=32*depth, kernel_size=5,
                                           kernel_initializer=tf.contrib.layers.xavier_initializer(),
                                           padding="same", name="conv_5_5_2")
        branch_conv_5_5 = norm_function(name="norm_conv_5_5_2")(branch_conv_5_5, train=is_train)
        branch_conv_5_5 = activ_function(branch_conv_5_5, "activation_5_5_2")

        # Branch 4: 128 x conv 7x7
        branch_conv_7_7 = tf.layers.conv1d(inputs=x_norm, filters=16, kernel_size=1,
                                           kernel_initializer=tf.contrib.layers.xavier_initializer(),
                                           padding="same", name="conv_7_7_1")
        branch_conv_7_7 = norm_function(name="norm_conv_7_7_1")(branch_conv_7_7, train=is_train)
        branch_conv_7_7 = activ_function(branch_conv_7_7, "activation_7_7_1")

        branch_conv_7_7 = tf.layers.conv1d(inputs=branch_conv_7_7, filters=32*depth, kernel_size=5,
                                           kernel_initializer=tf.contrib.layers.xavier_initializer(),
                                           padding="same", name="conv_7_7_2")
        branch_conv_7_7 = norm_function(name="norm_conv_7_7_2")(branch_conv_7_7, train=is_train)
        branch_conv_7_7 = activ_function(branch_conv_7_7, "activation_7_7_2")

        # Branch 5: 16 x (max_pool 3x3 + conv 1x1)
        branch_maxpool_3_3 = tf.layers.max_pooling1d(inputs=x_norm, pool_size=3, strides=1, padding="same", name="maxpool_3")
        branch_maxpool_3_3 = norm_function(name="norm_maxpool_3_3")(branch_maxpool_3_3, train=is_train)
        branch_maxpool_3_3 = tf.layers.conv1d(inputs=branch_maxpool_3_3, filters=16, kernel_size=1,
                                              kernel_initializer=tf.contrib.layers.xavier_initializer(),
                                              padding="same", name="conv_maxpool_3")

        # Branch 6: 16 x (max_pool 5x5 + conv 1x1)
        branch_maxpool_5_5 = tf.layers.max_pooling1d(inputs=x_norm, pool_size=5, strides=1, padding="same", name="maxpool_5")
        branch_maxpool_5_5 = norm_function(name="norm_maxpool_5_5")(branch_maxpool_5_5, train=is_train)
        branch_maxpool_5_5 = tf.layers.conv1d(inputs=branch_maxpool_5_5, filters=16, kernel_size=1,
                                              kernel_initializer=tf.contrib.layers.xavier_initializer(),
                                              padding="same", name="conv_maxpool_5")

        # Branch 7: 16 x (avg_pool 3x3 + conv 1x1)
        branch_avgpool_3_3 = tf.layers.average_pooling1d(inputs=x_norm, pool_size=3, strides=1, padding="same", name="avgpool_3")
        branch_avgpool_3_3 = norm_function(name="norm_avgpool_3_3")(branch_avgpool_3_3, train=is_train)
        branch_avgpool_3_3 = tf.layers.conv1d(inputs=branch_avgpool_3_3, filters=16, kernel_size=1,
                                              kernel_initializer=tf.contrib.layers.xavier_initializer(),
                                              padding="same", name="conv_avgpool_3")

        # Branch 8: 16 x (avg_pool 5x5 + conv 1x1)
        branch_avgpool_5_5 = tf.layers.average_pooling1d(inputs=x_norm, pool_size=5, strides=1, padding="same", name="avgpool_5")
        branch_avgpool_5_5 = norm_function(name="norm_avgpool_5_5")(branch_avgpool_5_5, train=is_train)
        branch_avgpool_5_5 = tf.layers.conv1d(inputs=branch_avgpool_5_5, filters=16, kernel_size=1,
                                              kernel_initializer=tf.contrib.layers.xavier_initializer(),
                                              padding="same", name="conv_avgpool_5")

        # Concatenate
        output = tf.concat([branch_conv_1_1, branch_conv_3_3, branch_conv_5_5, branch_conv_7_7, branch_maxpool_3_3,
                           branch_maxpool_5_5, branch_avgpool_3_3, branch_avgpool_5_5], axis=-1)
        return output
WavCeption design:
class NameSpacer:
    def __init__(self, **kwargs):
        self.__dict__.update(kwargs)

class Architecture:
    def __init__(self, class_cardinality, seq_len=16000, name="architecture"):
        self.seq_len = seq_len
        self.class_cardinality = class_cardinality
        self.optimizer = tf.train.AdamOptimizer(learning_rate=0.0001)
        self.name=name
        self.define_computation_graph()

        #Aliases
        self.ph = self.placeholders
        self.op = self.optimizers
        self.summ = self.summaries

    def define_computation_graph(self):
        # Reset graph
        tf.reset_default_graph()
        self.placeholders = NameSpacer(**self.define_placeholders())
        self.core_model = NameSpacer(**self.define_core_model())
        self.losses = NameSpacer(**self.define_losses())
        self.optimizers = NameSpacer(**self.define_optimizers())
        self.summaries = NameSpacer(**self.define_summaries())

    def define_placeholders(self):
        with tf.variable_scope("Placeholders"):
            wav_in = tf.placeholder(dtype=tf.float32, shape=(None, self.seq_len, 1), name="wav_in")
            is_train = tf.placeholder(dtype=tf.bool, shape=None, name="is_train")
            target = tf.placeholder(dtype=tf.int32, shape=(None, 1), name="target")
            acc_dev = tf.placeholder(dtype=tf.float32, shape=None, name="acc_dev")
            loss_dev = tf.placeholder(dtype=tf.float32, shape=None, name="loss_dev")
            return({"wav_in": wav_in, "target": target, "is_train": is_train, "acc_dev":
                    acc_dev, "loss_dev": loss_dev})

    def define_core_model(self):
        with tf.variable_scope("Core_Model"):
            x = inception_1d(x=self.placeholders.wav_in, is_train=self.placeholders.is_train,
                             norm_function=BatchNorm, activ_function=tf.nn.relu, depth=1,
                             name="Inception_1_1")
            x = inception_1d(x=x, is_train=self.placeholders.is_train, norm_function=BatchNorm,
                             activ_function=tf.nn.relu, depth=1, name="Inception_1_2")
            x = tf.layers.max_pooling1d(x, 2, 2, name="maxpool_1")
            x = inception_1d(x=x, is_train=self.placeholders.is_train, norm_function=BatchNorm,
                             activ_function=tf.nn.relu, depth=1, name="Inception_2_1")
            x = inception_1d(x=x, is_train=self.placeholders.is_train, norm_function=BatchNorm,
                             activ_function=tf.nn.relu, depth=1, name="Inception_2_3")
            x = tf.layers.max_pooling1d(x, 2, 2, name="maxpool_2")
            x = inception_1d(x=x, is_train=self.placeholders.is_train, norm_function=BatchNorm,
                             activ_function=tf.nn.relu, depth=2, name="Inception_3_1")
            x = inception_1d(x=x, is_train=self.placeholders.is_train, norm_function=BatchNorm,
                             activ_function=tf.nn.relu, depth=2, name="Inception_3_2")
            x = tf.layers.max_pooling1d(x, 2, 2, name="maxpool_3")
            x = inception_1d(x=x, is_train=self.placeholders.is_train, norm_function=BatchNorm,
                             activ_function=tf.nn.relu, depth=2, name="Inception_4_1")
            x = inception_1d(x=x, is_train=self.placeholders.is_train, norm_function=BatchNorm,
                             activ_function=tf.nn.relu, depth=2, name="Inception_4_2")
            x = tf.layers.max_pooling1d(x, 2, 2, name="maxpool_4")
            x = inception_1d(x=x, is_train=self.placeholders.is_train, norm_function=BatchNorm,
                             activ_function=tf.nn.relu, depth=3, name="Inception_5_1")
            x = inception_1d(x=x, is_train=self.placeholders.is_train, norm_function=BatchNorm,
                             activ_function=tf.nn.relu, depth=3, name="Inception_5_2")
            x = tf.layers.max_pooling1d(x, 2, 2, name="maxpool_5")
            x = inception_1d(x=x, is_train=self.placeholders.is_train, norm_function=BatchNorm,
                             activ_function=tf.nn.relu, depth=3, name="Inception_6_1")
            x = inception_1d(x=x, is_train=self.placeholders.is_train, norm_function=BatchNorm,
                             activ_function=tf.nn.relu, depth=3, name="Inception_6_2")
            x = tf.layers.max_pooling1d(x, 2, 2, name="maxpool_6")
            x = inception_1d(x=x, is_train=self.placeholders.is_train, norm_function=BatchNorm,
                             activ_function=tf.nn.relu, depth=4, name="Inception_7_1")
            x = inception_1d(x=x, is_train=self.placeholders.is_train, norm_function=BatchNorm,
                             activ_function=tf.nn.relu, depth=4, name="Inception_7_2")
            x = tf.layers.max_pooling1d(x, 2, 2, name="maxpool_7")
            x = inception_1d(x=x, is_train=self.placeholders.is_train, norm_function=BatchNorm,
                             activ_function=tf.nn.relu, depth=4, name="Inception_8_1")
            x = inception_1d(x=x, is_train=self.placeholders.is_train, norm_function=BatchNorm,
                             activ_function=tf.nn.relu, depth=4, name="Inception_8_2")
            x = tf.layers.max_pooling1d(x, 2, 2, name="maxpool_8")
            x = inception_1d(x=x, is_train=self.placeholders.is_train, norm_function=BatchNorm,
                             activ_function=tf.nn.relu, depth=4, name="Inception_9_1")
            x = inception_1d(x=x, is_train=self.placeholders.is_train, norm_function=BatchNorm,
                             activ_function=tf.nn.relu, depth=4, name="Inception_9_2")
            x = tf.layers.max_pooling1d(x, 2, 2, name="maxpool_9")
            x = tf.contrib.layers.flatten(x)
            x = tf.layers.dense(BatchNorm(name="bn_dense_1")(x,train=self.placeholders.is_train),
                                128, activation=tf.nn.relu, kernel_initializer=tf.contrib.layers.xavier_initializer(),
                                name="dense_1")
            output = tf.layers.dense(BatchNorm(name="bn_dense_2")(x,train=self.placeholders.is_train),
                                self.class_cardinality, activation=None, kernel_initializer=tf.contrib.layers.xavier_initializer(),
                                name="output")
            return({"output": output})

    def define_losses(self):
        with tf.variable_scope("Losses"):
            softmax_ce = tf.nn.sparse_softmax_cross_entropy_with_logits(labels=tf.squeeze(self.placeholders.target),
                                                                        logits=self.core_model.output,
                                                                        name="softmax")
            return({"softmax": softmax_ce})

    def define_optimizers(self):
        with tf.variable_scope("Optimization"):
            op = self.optimizer.minimize(self.losses.softmax)
            return({"op": op})

    def define_summaries(self):
        with tf.variable_scope("Summaries"):
            ind_max = tf.squeeze(tf.cast(tf.argmax(self.core_model.output, axis=1), tf.int32))
            target = tf.squeeze(self.placeholders.target)
            acc= tf.reduce_mean(tf.cast(tf.equal(ind_max, target), tf.float32))
            loss = tf.reduce_mean(self.losses.softmax)
            train_scalar_probes = {"accuracy": acc,
                                   "loss": loss}
            train_performance_scalar = [tf.summary.scalar(k, tf.reduce_mean(v), family=self.name)
                                        for k, v in train_scalar_probes.items()]
            train_performance_scalar = tf.summary.merge(train_performance_scalar)

            dev_scalar_probes = {"acc_dev": self.placeholders.acc_dev,
                                 "loss_dev": self.placeholders.loss_dev}
            dev_performance_scalar = [tf.summary.scalar(k, v, family=self.name) for k, v in dev_scalar_probes.items()]
            dev_performance_scalar = tf.summary.merge(dev_performance_scalar)
            return({"accuracy": acc, "loss": loss, "s_tr": train_performance_scalar, "s_de": dev_performance_scalar})
Model Summary:
This model is a deep learning model called WavCeption (or Inception-1D) designed to process 1-dimensional audio signals. Here's the main architecture:
1. Basic Structure:
- Multiple Inception-1D modules stacked sequentially
- Max pooling layers placed between each Inception module
- Classification performed using Fully Connected layers at the end
2. Inception-1D Module (8 parallel branches):
- Branch 1: 1x1 convolution
- Branch 2: 1x1 conv → 3x3 conv
- Branch 3: 1x1 conv → 5x5 conv
- Branch 4: 1x1 conv → 7x7 conv
- Branch 5: 3x3 max pool → 1x1 conv
- Branch 6: 5x5 max pool → 1x1 conv
- Branch 7: 3x3 avg pool → 1x1 conv
- Branch 8: 5x5 avg pool → 1x1 conv
3. Parallel Branches
- The parallel branches in the Inception-1D module refer to a structure that processes input data simultaneously through multiple different paths.
- Here's an explanation with examples:
Input Data
↓
[branch 1] → 1x1 conv
[branch 2] → 1x1 conv → 3x3 conv
[branch 3] → 1x1 conv → 5x5 conv
[branch 4] → 1x1 conv → 7x7 conv
[branch 5] → 3x3 maxpool → 1x1 conv
[branch 6] → 5x5 maxpool → 1x1 conv
[branch 7] → 3x3 avgpool → 1x1 conv
[branch 8] → 5x5 avgpool → 1x1 conv
↓
Concatenate outputs from all branches
- Characteristics of Each Branch:
- Receives the same input but processes it differently
- Uses filters of different sizes (1x1, 3x3, 5x5, 7x7)
- Performs different types of operations (convolution, max pooling, average pooling)
- Advantages:
- Can extract features at different scales simultaneously
- Utilizes advantages of both small and large filters
- Network automatically learns the most useful features
4. Complete Network Structure:
Input → Inception(x2) → MaxPool →
Inception(x2) → MaxPool →
Inception(x2) → MaxPool →
Inception(x2) → MaxPool →
Inception(x2) → MaxPool →
Inception(x2) → MaxPool →
Inception(x2) → MaxPool →
Inception(x2) → MaxPool →
Inception(x2) → MaxPool →
Flatten → Dense(128) → Output
5. Key Features:
- BatchNormalization and ReLU activation functions used in all convolution layers
- Number of filters in each layer controlled by depth parameter (depth increases in upper layers)
- Input is a 1D audio signal of 16000 samples
- Uses Xavier initialization
- Uses Adam optimizer
Success is not for the faint-hearted. It requires determination, discipline, and unwavering focus.
- Max Holloway -
'캐글' 카테고리의 다른 글
| [Kaggle Study] #8 2018 Data Science Bowl (0) | 2024.11.28 |
|---|---|
| [Kaggle Study] #6 Costa Rican Household Poverty Level Prediction (1) | 2024.11.28 |
| [Kaggle Study] #4 More about Home Credit Default Risk Competition (0) | 2024.11.26 |
| [Kaggle Study] #5 Statoil/C-CORE Iceberg Classifier Challenge (0) | 2024.11.25 |
| [Kaggle Study] #3 Home Credit Default Risk (1) | 2024.11.24 |