반응형
Annotation of modeling & SHAP part of this kernel:
Understanding Survival Analysis
Explore and run machine learning code with Kaggle Notebooks | Using data from CIBMTR - Equity in post-HCT Survival Predictions
www.kaggle.com
XGBoost Model for Survival
- We will now use an XGBoost model with Optuna to find the ideal hyperparameters.
- This model will be used to submit predictions.
- This XGBoost model implements survival analysis using the Cox proportional hazards (CPH) loss function, a widely used approach for time-to-event modeling.
- It predicts risk scores for patients undergoing hematopoietic cell transplantation (HCT), leveraging features such as patient demographics and clinical characteristics.
- The CPH model ranks patients based on their relative risk of experiencing an event, such as death or relapse.
- It evaluates performance using metrics like the concordance index (C-index), which measures the model’s ability to rank patients by their predicted risk correctly.
import pandas as pd
import numpy as np
from sklearn.model_selection import train_test_split
from sklearn.metrics import mean_squared_error, mean_absolute_error, r2_score
from xgboost import XGBRegressor
import optuna

# Load the data
train_path = "/kaggle/input/equity-post-HCT-survival-predictions/train.csv"
data_dict = "/kaggle/input/equity-post-HCT-survival-predictions/data_dictionary.csv"

train_df = pd.read_csv(train_path)
data_info_df = pd.read_csv(data_dict)

# Preprocessing
epsilon = 1e-5
from sklearn.preprocessing import LabelEncoder
label_encoder = LabelEncoder()

for index, row in data_info_df.iterrows():
    if row["type"] == "Categorical":
        # Encode categorical variables as numbers
        train_df[row["variable"]] = label_encoder.fit_transform(train_df[row["variable"]].astype(str))
    else:
        # Fill missing values in numerical variables with -1
        train_df[row["variable"]] = train_df[row["variable"]].fillna(-1)

# Define target variable
train_df["y"] = train_df["efs"] / (train_df["efs_time"] + epsilon)

# Define features and target
X = train_df.drop(columns=["efs", "efs_time", "ID", "y"])
y = train_df["y"]

# Train-test split
X_train, X_test, y_train, y_test = train_test_split(X, y, test_size=0.2, random_state=42)

# Optuna objective function
def objective(trial):
    # Hyperparameter search space
    params = {
        "n_estimators": trial.suggest_int("n_estimators", 100, 2000, step=100),
        "learning_rate": trial.suggest_float("learning_rate", 0.01, 0.3, log=True),
        "max_depth": trial.suggest_int("max_depth", 3, 15),
        "subsample": trial.suggest_float("subsample", 0.6, 1.0),
        "colsample_bytree": trial.suggest_float("colsample_bytree", 0.6, 1.0),
        "reg_alpha": trial.suggest_float("reg_alpha", 1e-5, 1.0, log=True),
        "reg_lambda": trial.suggest_float("reg_lambda", 1e-5, 1.0, log=True),
        "early_stopping_rounds": 50  # Move early stopping here
    }

    # Train the model
    model = XGBRegressor(random_state=42, **params)
    model.fit(
        X_train, y_train,
        eval_set=[(X_test, y_test)],
        verbose=False
    )

    # Predictions and evaluation
    y_pred = model.predict(X_test)
    rmse = mean_squared_error(y_test, y_pred, squared=False)
    return rmse

# Run Optuna
study = optuna.create_study(direction="minimize")
study.optimize(objective, n_trials=50)

# Best parameters and RMSE
print("Best parameters:", study.best_params)
print("Best RMSE:", study.best_value)

# Train the final model with the best parameters
best_params = study.best_params
final_model = XGBRegressor(random_state=42, **best_params)
final_model.fit(X_train, y_train)

# Final predictions and evaluation
y_pred = final_model.predict(X_test)
rmse = mean_squared_error(y_test, y_pred, squared=False)
mae = mean_absolute_error(y_test, y_pred)
r2 = r2_score(y_test, y_pred)

print(f"Final RMSE: {rmse:.4f}")
print(f"Final MAE: {mae:.4f}")
print(f"Final R²: {r2:.4f}")
Reason why we set target variable as train_df["y"] = train_df["efs"] / (train_df["efs_time"] + epsilon)
This calculation means:
- efs (event-free survival): whether an event (death or relapse) occurred (0 or 1)
- efs_time: observation period
- epsilon (1e-5): very small number to prevent division by zero
Reasons for this division:
- Time normalization
- Same events might have different importance depending on when they occurred
- Example: relapse within 1 year vs relapse after 5 years
- Reflects hazard concept
- Higher value means event occurred more quickly
- Examples:
- case 1: efs=1, time=1 year → y ≈ 1
case 2: efs=1, time=5 years → y ≈ 0.2
case 3: efs=0, time=any → y = 0
- case 1: efs=1, time=1 year → y ≈ 1
- Reflects survival analysis characteristics
- Censored cases (efs=0) automatically become 0
- Cases with events get different weights based on occurrence time
This target variable becomes an indicator of "event occurrence risk per unit time."
Scoring the submission
from lifelines.utils import concordance_index

# Define the score function
def score(solution: pd.DataFrame, submission: pd.DataFrame, row_id_column_name: str) -> float:
    """
    Calculate C-index for each race group and return the global score.
    """
    del solution[row_id_column_name]
    del submission[row_id_column_name]

    event_label = 'efs'
    interval_label = 'efs_time'
    prediction_label = 'prediction'
    for col in submission.columns:
        if not pd.api.types.is_numeric_dtype(submission[col]):
            raise ValueError(f'Submission column {col} must be a number')

    # Merging solution and submission dfs on ID
    merged_df = pd.concat([solution, submission], axis=1)
    merged_df.reset_index(inplace=True)
    merged_df_race_dict = dict(merged_df.groupby(['race_group']).groups)
    metric_list = []
    for race in merged_df_race_dict.keys():
        # Retrieving values from y_test based on index
        indices = sorted(merged_df_race_dict[race])
        merged_df_race = merged_df.iloc[indices]
        # Calculate the concordance index
        c_index_race = concordance_index(
                        merged_df_race[interval_label],
                        -merged_df_race[prediction_label],
                        merged_df_race[event_label])
        metric_list.append(c_index_race)
    return float(np.mean(metric_list) - np.sqrt(np.var(metric_list)))

# Final predictions
y_pred = final_model.predict(X_test)

# Prepare DataFrames for scoring
y_true_df = train_df.iloc[X_test.index][["ID", "efs", "efs_time", "race_group"]].copy()
y_pred_df = train_df.iloc[X_test.index][["ID"]].copy()
y_pred_df["prediction"] = y_pred

# Calculate the stratified C-index
stratified_c_index = score(y_true_df, y_pred_df, "ID")
print(f"Stratified C-index: {stratified_c_index:.4f}")
Stratified C-index: 0.6716
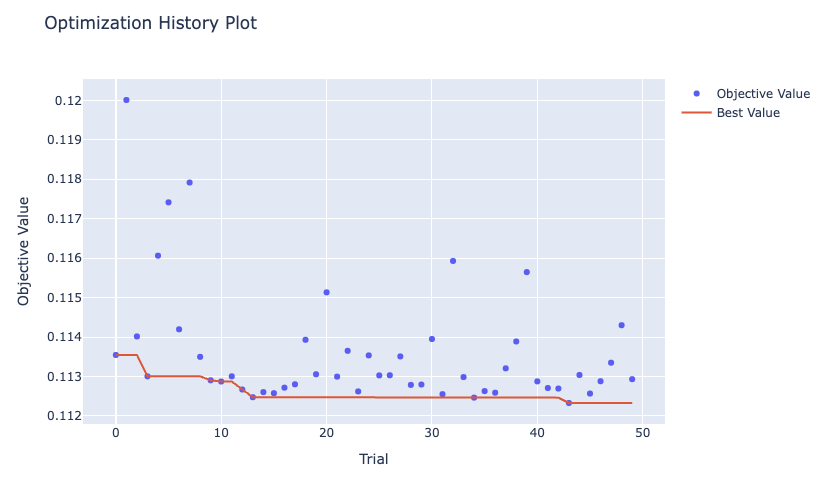
import optuna.visualization as vis

# Plot optimization history (objective value per trial)
fig = vis.plot_optimization_history(study)
fig.show()
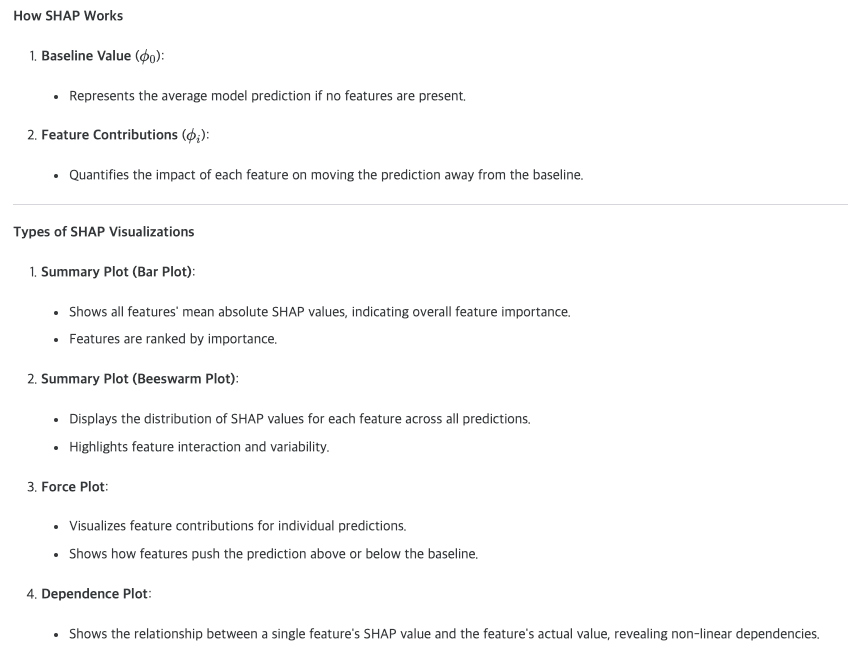
SHAP (SHapley Additive exPlanations)
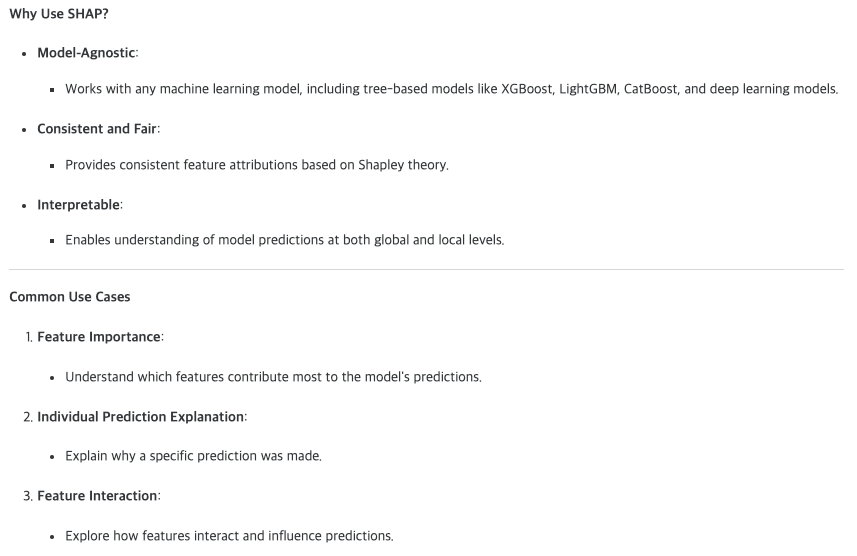
- SHAP (SHapley Additive exPlanations) is a unified framework for interpreting machine learning models.
- It is based on cooperative game theory and provides insights into the contribution of each feature to a model's predictions.


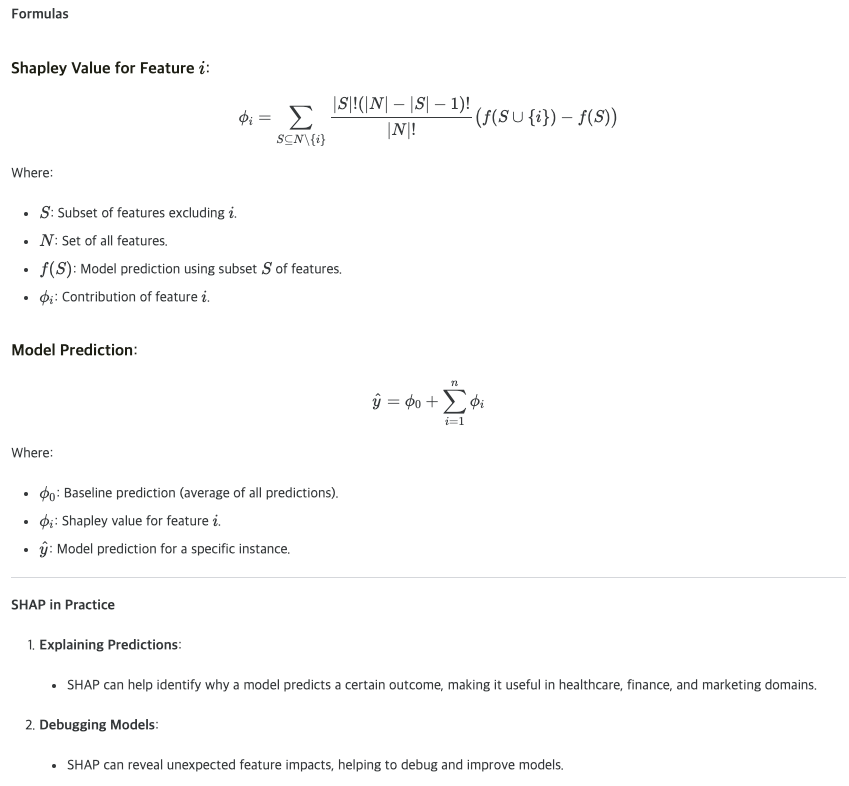
Formula for Shapley Value (φᵢ) of a specific Feature i:
- S: subset of features excluding feature i
- N: set of all features
- |S|: number of features in S
- |N|: total number of features
- f(S): model prediction using only features in S
- f(S∪{i}): model prediction when feature i is added to S
- (|S|!(|N|-|S|-1)!)/(|N|!):
- formula for calculating weights, related to permutations and combinations
- |S|! : factorial of the number of features in S
- (|N|-|S|-1)! : factorial of (total number of features minus S's features minus 1)
- |N|! : factorial of total number of features
- Why this weight is necessary:
- Contribution can be calculated differently depending on feature order
- To calculate average contribution considering all possible orders
- If total features are 3 (N={A,B,C}),
feature i is A, and
S is {B}:
|S| = 1 (just B)
|N| = 3 (A,B,C three features)
|N|-|S|-1 = 1 (3-1-1)
Therefore:
(1! * 1!) / 3! = (1 * 1) / 6 = 1/6 - This weight is used to calculate the average influence of feature A when considering all possible orders in which it can be combined with other features.
- This formula calculates "how much feature i contributes to predictions when combined with other features."
Formula for Final Model Prediction (ŷ):
- φ₀: base prediction (average of all predictions)
- φᵢ: Shapley value of each feature
- ŷ: final prediction for a specific instance
- This formula means "create the final prediction by adding each feature's contribution to the base prediction."

import shap
import matplotlib.pyplot as plt
from tqdm import tqdm
import numpy as np

# Use only the first 100 rows of X
X = X.iloc[:100, :]

# Clean feature names by replacing special characters
X.columns = (
    X.columns.str.replace(r"\[", "_", regex=True)
             .str.replace(r"\]", "_", regex=True)
             .str.replace(r"<", "_", regex=True)
)

# Initialize SHAP TreeExplainer
explainer = shap.TreeExplainer(final_model)  # Use TreeExplainer with the XGBoost model

# Compute SHAP values for all rows at once
shap_values = explainer.shap_values(X)

# Summary plot: Displays the importance of features
shap.summary_plot(shap_values, X, plot_type="bar")  # Bar plot of mean absolute SHAP values
# Summary plot: Detailed distribution of feature impacts
shap.summary_plot(shap_values, X)  # Beeswarm plot
Creating submission csv
import pandas as pd
import numpy as np
from sklearn.preprocessing import LabelEncoder
from xgboost import XGBRegressor

# Load the test and sample submission files
test = pd.read_csv('/kaggle/input/equity-post-HCT-survival-predictions/test.csv')
sample_submission = pd.read_csv('/kaggle/input/equity-post-HCT-survival-predictions/sample_submission.csv')

# Load the training data for consistent preprocessing
train = pd.read_csv('/kaggle/input/equity-post-HCT-survival-predictions/train.csv')

# Preprocessing: Handle categorical and numerical variables consistently
label_encoder = LabelEncoder()

for column in train.columns:
    if column in ["efs", "efs_time"]:  # Skip target variables not present in the test set
        continue

    if train[column].dtype == 'object':  # Handle categorical variables
        test[column] = test[column].fillna("NAN")
        train[column] = train[column].fillna("NAN")
        label_encoder.fit(pd.concat([train[column], test[column]], axis=0))
        test[column] = label_encoder.transform(test[column])
    else:  # Handle numerical variables
        test[column] = test[column].fillna(-1)  # Replace missing values with -1

# Define features to align with the training data
FEATURES = [col for col in train.columns if col not in ["ID", "efs", "efs_time", "y"]]

# Ensure the test set matches the feature space of the training data
missing_cols = [col for col in FEATURES if col not in test.columns]
for col in missing_cols:
    test[col] = 0  # Add missing columns with default values

test = test[FEATURES]  # Reorder columns to match the training feature space

# Make predictions on the test set
test['predicted_risk'] = final_model.predict(test)

# Prepare the submission file
sample_submission['prediction'] = test['predicted_risk']

# Check for any missing or invalid values in the predictions
if sample_submission['prediction'].isnull().any():
    raise ValueError("The submission file contains NaN values. Please check your predictions.")

# Save the submission file in the correct format
sample_submission.to_csv('submission.csv', index=False)

# Display the first few rows of the submission file to verify
sample_submission.head()
꿈을 크게 가져야 깨져도 그 조각이 크다.
반응형