반응형
Annotation of Chris Deotte's discussion about "How To Get Started - Understanding the Metric".
https://www.kaggle.com/competitions/equity-post-HCT-survival-predictions/discussion/550003
CIBMTR - Equity in post-HCT Survival Predictions
Improve prediction of transplant survival rates equitably for allogeneic HCT patients
www.kaggle.com
C-Index Explained
- The competition metric is Stratified Concordance Index.
- Let's explain how C-Index works (and let's ignore stratified for now).
- Here is the formula:

Ground Truth and Predictions
- Here is an image which will help us understand what this means:
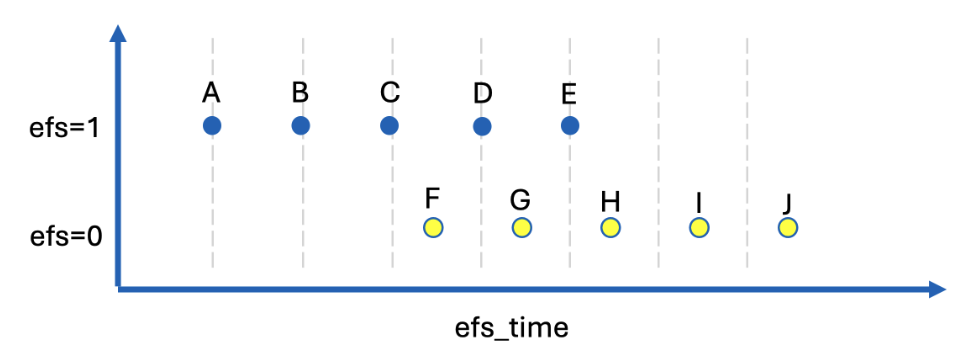
- Imagine that there are only 10 rows in the train.csv file shown above as 10 dots.
- There are 5 efs=1 and 5 efs=0.
- The efs_time is displayed in the plot above.
- Points A, B, C, D, E have efs=1, and points F, G, H, I, J have efs=0.
- The point A has the least efs_time and the point J has the greatest efs_time.
- Each patient with efs=1 had an event, and the time before event was efs_time.
- Each patient with efs=0 we do not know if they had an event or did not have an event.
- All we know is that they were without event for at least efs_time long.
- To summarize, each efs=1 was without event for exactly efs_time.
- And each efs=0 was without event for at least efs_time.
How To Compute C-Index Denominator
- The C-Index metric is a ranking metric similar to AUC.
- The denominator counts all pairs of dots where we know ground truth T_j < T_i where T is the actual time without event (note when efs=0 then actual time without event > efs_time and when efs=1 then actual time without event = efs_time).
- T represents the "actual time without event" of a patient
- efs=1 indicates the occurrence of an event (e.g., death)
- efs=0 indicates a censored case (end of follow-up)
- Actual survival time (T) in two situations:
- case 1) When efs=1:
- T = efs_time
- We can know the exact survival time
case 2) When efs=0:
- T > efs_time
- We only know that they survived beyond the last observation point (efs_time)
- case 1) When efs=1:
- Examples of when we can determine "T_j < T_i":
- # Example:
Patient1: efs=1, efs_time=10 → T1=10
Patient2: efs=0, efs_time=15 → T2>15
Patient3: efs=1, efs_time=20 → T3=20
# Comparable pairs:
- T1 < T3 (10 < 20)
- T1 < T2 (10 < T2, where T2 is greater than 15)
- # Example:
- Meaning of C-Index denominator:
- Among all possible patient pairs (i,j)
- Count the number of pairs where we can definitively determine "who lived longer"
- The reason for calculating this way is that for censored cases (efs=0), we don't know the exact survival time, so we only include pairs that can be definitively compared in the evaluation.
- The variables i and j are indices that range over every dot. In the example above, there are 32 possible pairs that we know T_j < T_i:
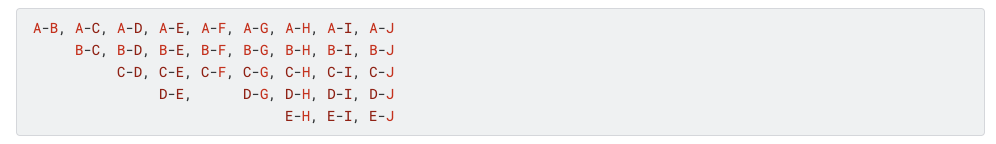
- Note we do not know if D is less than F because we do not know the actual time without event for F, we only know that F's time without event is at least what it appears in the plot above (because F is efs=0).
- Also we do not know if G is less than H because we do not know actual time without event for G nor H (both are efs=0).
How To Compute C-Index Numerator
- The C-Index numerator is about our predictions.
- For the 32 pairs above, we count how many of our predictions also follow these inequalities.
- For example, is our prediction A greater than B? Is our prediction A greater than C? etc etc.
- We ask 32 questions.
- The last is, is our prediction E greater than J.
- If all 32 questions answer yes, then our metric score = 1.
- If all questions answer no, then our metric score = 0.
- If 22 questions answer yes, then our metric score = 22/32 = 0.6875.
- (Note that inequalities in denominator are less than (and about time).
- And our predictions for the same pairs are greater than (and about risk).
- This is because the denominator represents times being less than.
- And our numerator represents risks being greater than.
- In other words a patient with a shorter time without event has a greater risk.
- And we are predicting risk factor.
- (If you get this backwards, just change your predictions with pred = -1 * pred).)
How To Build a Model
- If we only use efs as classification 0 or 1, to train our model (like current public notebooks), then our model will not be able to correctly compare A and C which both have efs=1.
- If we use efs_time as regression, then our model can be smarter.
- And if we use both efs and efs_time to train our model (classification/regression), our model will be smartest!
Starter Notebook
- There are two ways to approach this competition and utilize both efs and efs_time:
- Combine efs and efs_time ourselves into a new single target.
- Then train a model using either classification or regression (on the new single target).
- This is what i do in my XGB starter notebook here and NN starter notebook here.
- XGB starter notebook: https://www.kaggle.com/code/cdeotte/xgboost-catboost-baseline-cv-668-lb-668
- No annotation due to lower cv, lb score (0.668)
- Basically https://dongsunseng.com/entry/CIBMTR-Equity-in-post-HCT-Survival-Predictions-4-GPU-LightGBM-Baseline-CV-681-LB-685 without survival model(cox, kaplan meier)
- My annotation on NN starter notebook:
- XGB starter notebook: https://www.kaggle.com/code/cdeotte/xgboost-catboost-baseline-cv-668-lb-668
- (Note each uses a different transformed target and we can experiment making more transformed targets to find the best!)
- Use a model that supports survival loss (i.e. Cox or AFT).
- Then we leave efs and efs_time as is and input both into the model.
- The model learns from both and predicts a single target for us.
- More discussion about this here.
- My annotation on the discussion: https://dongsunseng.com/entry/CIBMTR-Equity-in-post-HCT-Survival-Predictions-6-How-To-Train-XGBoost-with-Survival-Loss
- Combine efs and efs_time ourselves into a new single target.
How To Compute Metric in Notebook
- To compute the competition metric in your notebook, attached this notebook here which contains WHL files (because we need to pip install with internet off to be able to submit to comp).
- Also attach Kaggle's metic notebook here.
- Then add the following code in the first cell:
!pip install /kaggle/input/pip-install-lifelines/autograd-1.7.0-py3-none-any.whl
!pip install /kaggle/input/pip-install-lifelines/autograd-gamma-0.5.0.tar.gz
!pip install /kaggle/input/pip-install-lifelines/interface_meta-1.3.0-py3-none-any.whl
!pip install /kaggle/input/pip-install-lifelines/formulaic-1.0.2-py3-none-any.whl
!pip install /kaggle/input/pip-install-lifelines/lifelines-0.30.0-py3-none-any.whl- Afterward to compute the competition metric, run this code where preds are your oof predictions:
from metric import score
y_true = train[["ID","efs","efs_time","race_group"]].copy()
y_pred = train[["ID"]].copy()
y_pred["prediction"] = preds
m = score(y_true.copy(), y_pred.copy(), "ID")
print(f"CV Score = {m}")
Calculating c-index(from turkenm's comment)

- Misunderstanding: Thought that all efs=0 patients should have lower risk scores than efs=1 patients
- However, the author of the kernel corrected:
- "Not all efs=0 predictions need to be lower than efs=1.
Only efs=0 cases where efs_time is greater than all efs=1 cases need to have lower risk scores."
- "Not all efs=0 predictions need to be lower than efs=1.
- Example:
- # Case examples
Patient A: efs=1, efs_time=10 # Event occurred on day 10
Patient B: efs=0, efs_time=5 # Censored on day 5
Patient C: efs=0, efs_time=15 # Censored on day 15
Patient D: efs=1, efs_time=8 # Event occurred on day 8
# Only Patient C has efs_time greater than all efs=1
# Therefore, only Patient C's risk score needs to be lower than efs=1 patients
# Patient B's risk score can be any value - Why Patient B's risk score can be any value
- Patient A: efs=1, efs_time=10 # Death confirmed on day 10
Patient B: efs=0, efs_time=5 # Observation stopped after day 5
Patient D: efs=1, efs_time=8 # Death confirmed on day 8 - From a C-index calculation perspective:
- C-Index is only included in calculations when survival times between two patients can be compared
- Patient B has no information after day 5, making clear comparisons with other patients impossible
- Therefore, Patient B's risk score does not affect C-Index calculation
- In contrast for patient C:
- Survival is confirmed until day 15
- Comparable with Patient A (died on day 10)
- We can definitively know that Patient C lived longer than Patient A
- Therefore, Patient C's risk score should be lower than Patient A's
- Also comparable with Patient D (died on day 8)
- We can definitively know that Patient C lived longer than Patient D
- Therefore, Patient C's risk score should also be lower than Patient D's
- Patient A: efs=1, efs_time=10 # Death confirmed on day 10
- # Case examples
- Special Case (efs=0, efs_time=0):
- These cases are not included in C-Index calculation at all
- Therefore, predictions for such cases don't affect the final score
- Not necessary to predict low risk for all censored cases (efs=0)
- Can selectively predict low risk considering efs_time
- This allows the model to learn more flexibly
- This understanding enables creating more effective survival analysis models.
Understanding delta_j

- Summary on Daniel's Question:
- Checking if delta_j in C-Index calculation means the efs value (0 or 1)
- Curious about how our predicted risk values are evaluated
- Asking if perfect prediction is possible

- Summary of Chris's Answer:
- # Elements used in C-Index calculation:
- T_j, T_i: represent efs_time values
- delta_j: represents efs value
- N_j, N_i: represent our predictions - Model should not try to directly predict efs_time
- Reason: efs_time is randomly hidden due to censoring
- Instead, should predict 'risk score'
- Because risk is actually related to features (X features)
- Example:
- # Wrong approach
Patient A: survived 10 days -> model tries to predict 10
Patient B: censored at 5 days -> actual survival unknown
# Correct approach
Patient A: high risk -> expect short survival
Patient B: low risk -> expect long survival
- # Wrong approach
- # Elements used in C-Index calculation:
성공한 자의 과거는 비참할수록 아름답다.
반응형